Something is in the Food
An original longform web documentary investigating the 2026 cyclosporiasis outbreak in the United States using scrollytelling data visualizations, a D3.js choropleth map, and parallax photography.
Overview
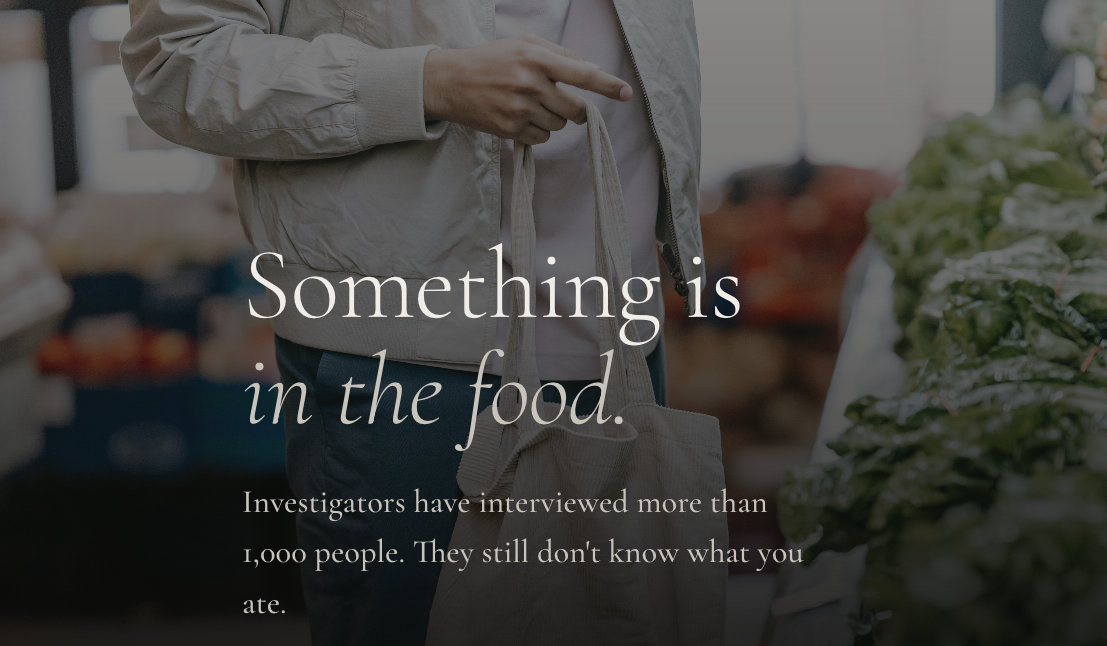
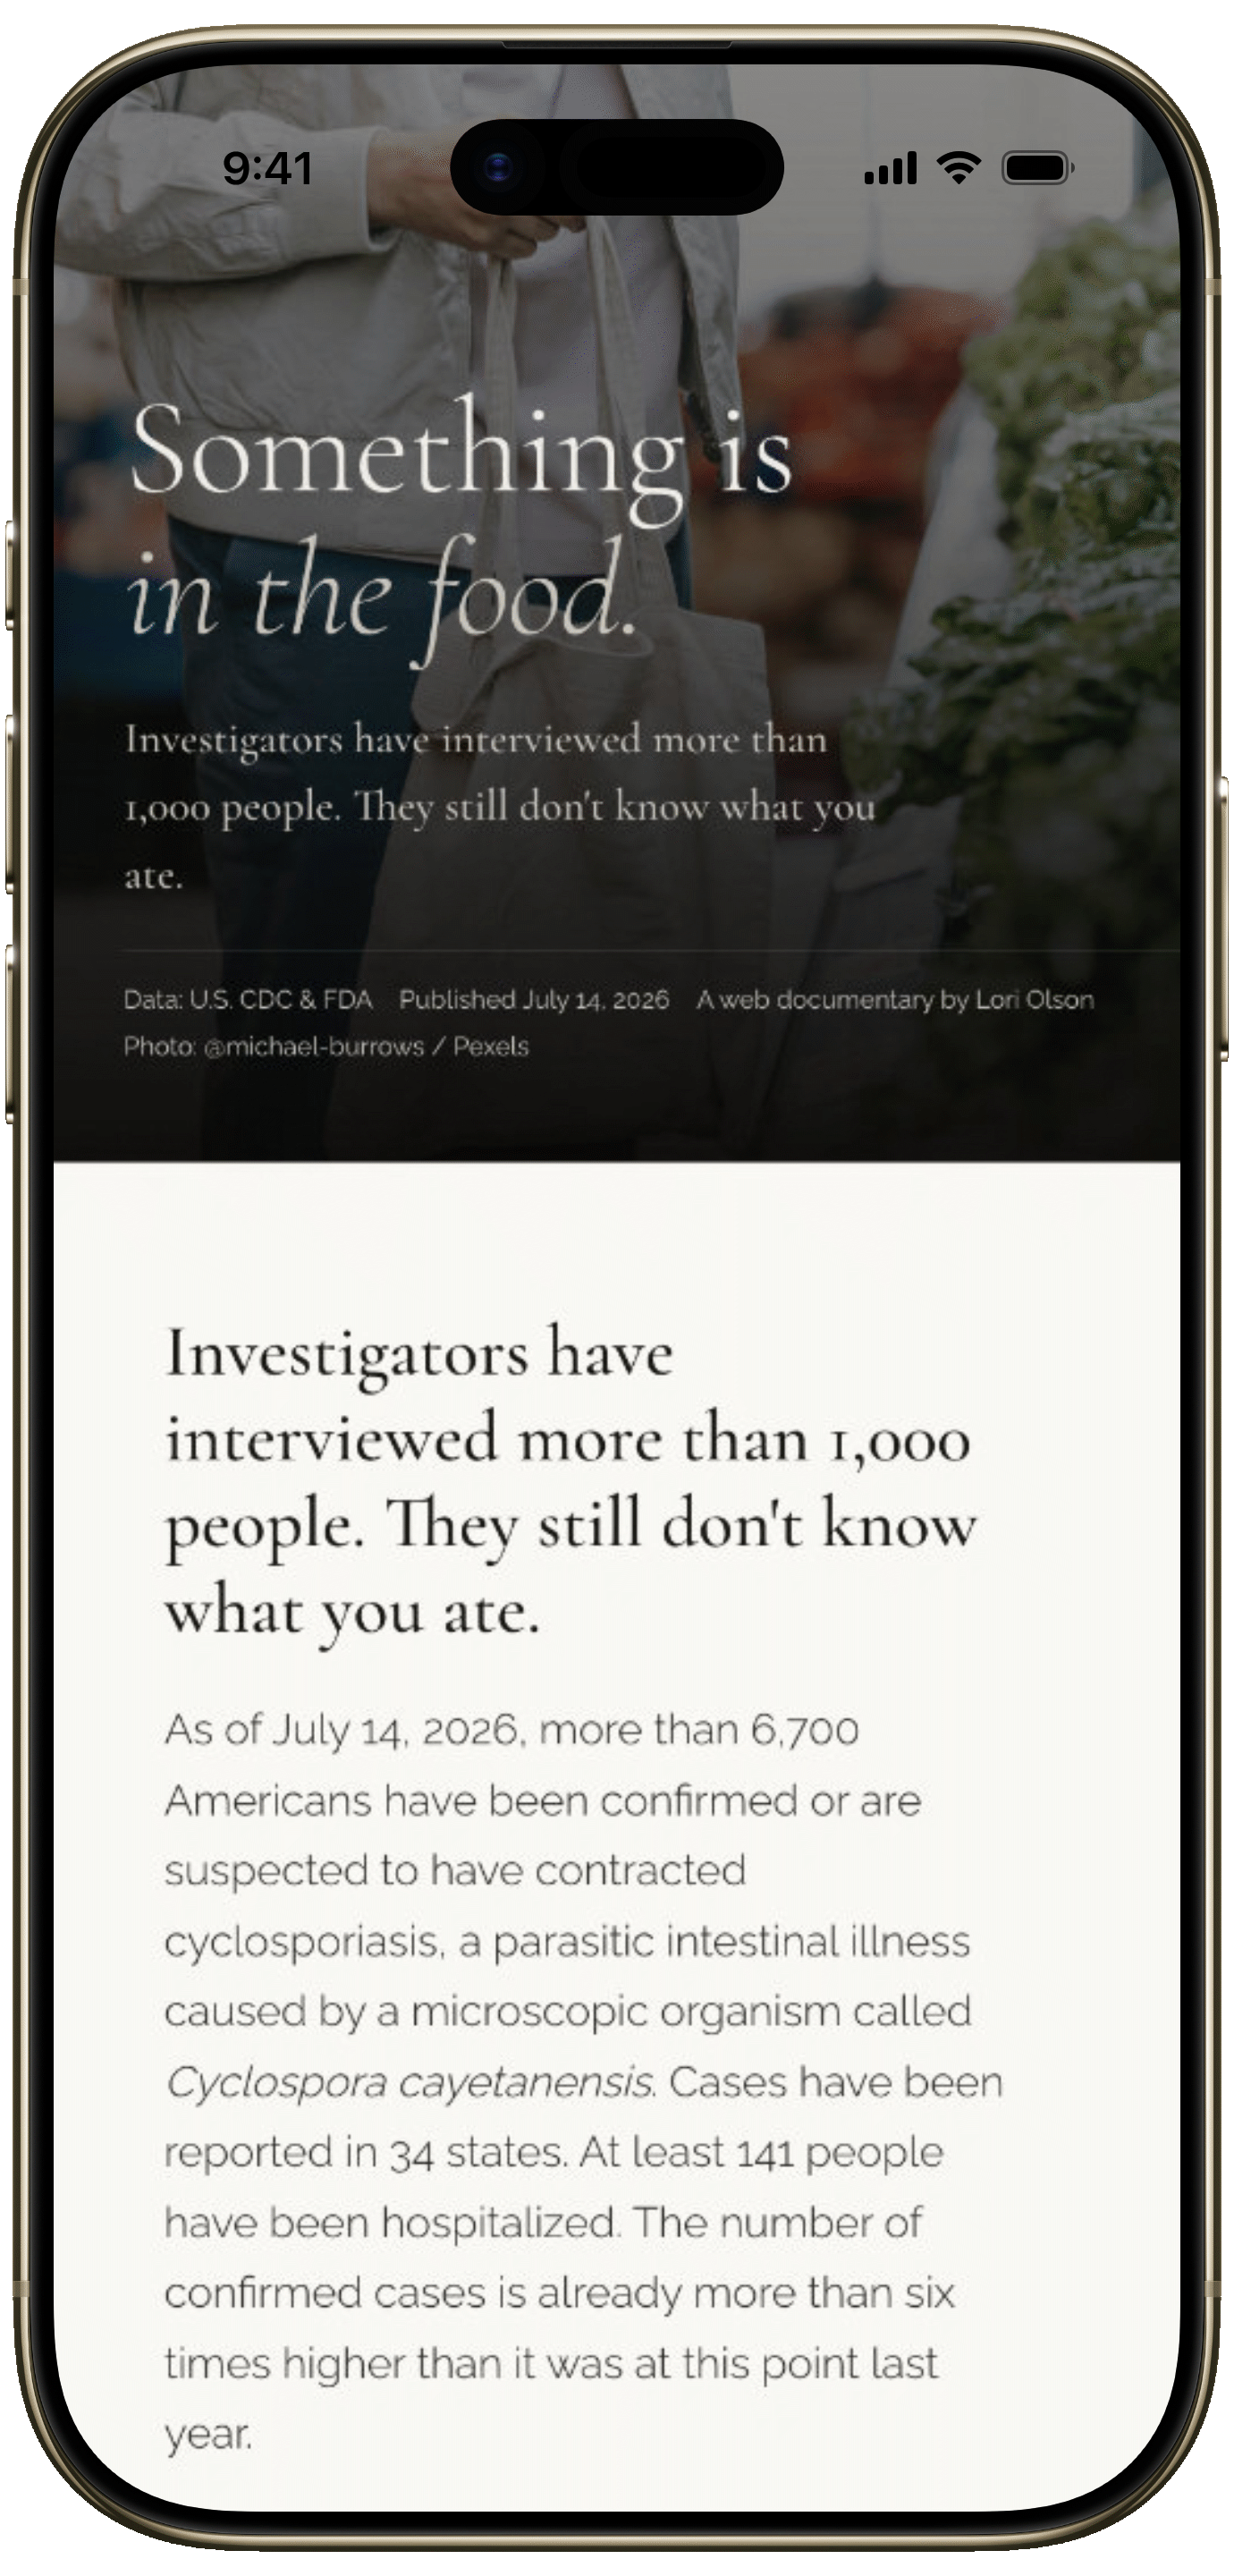
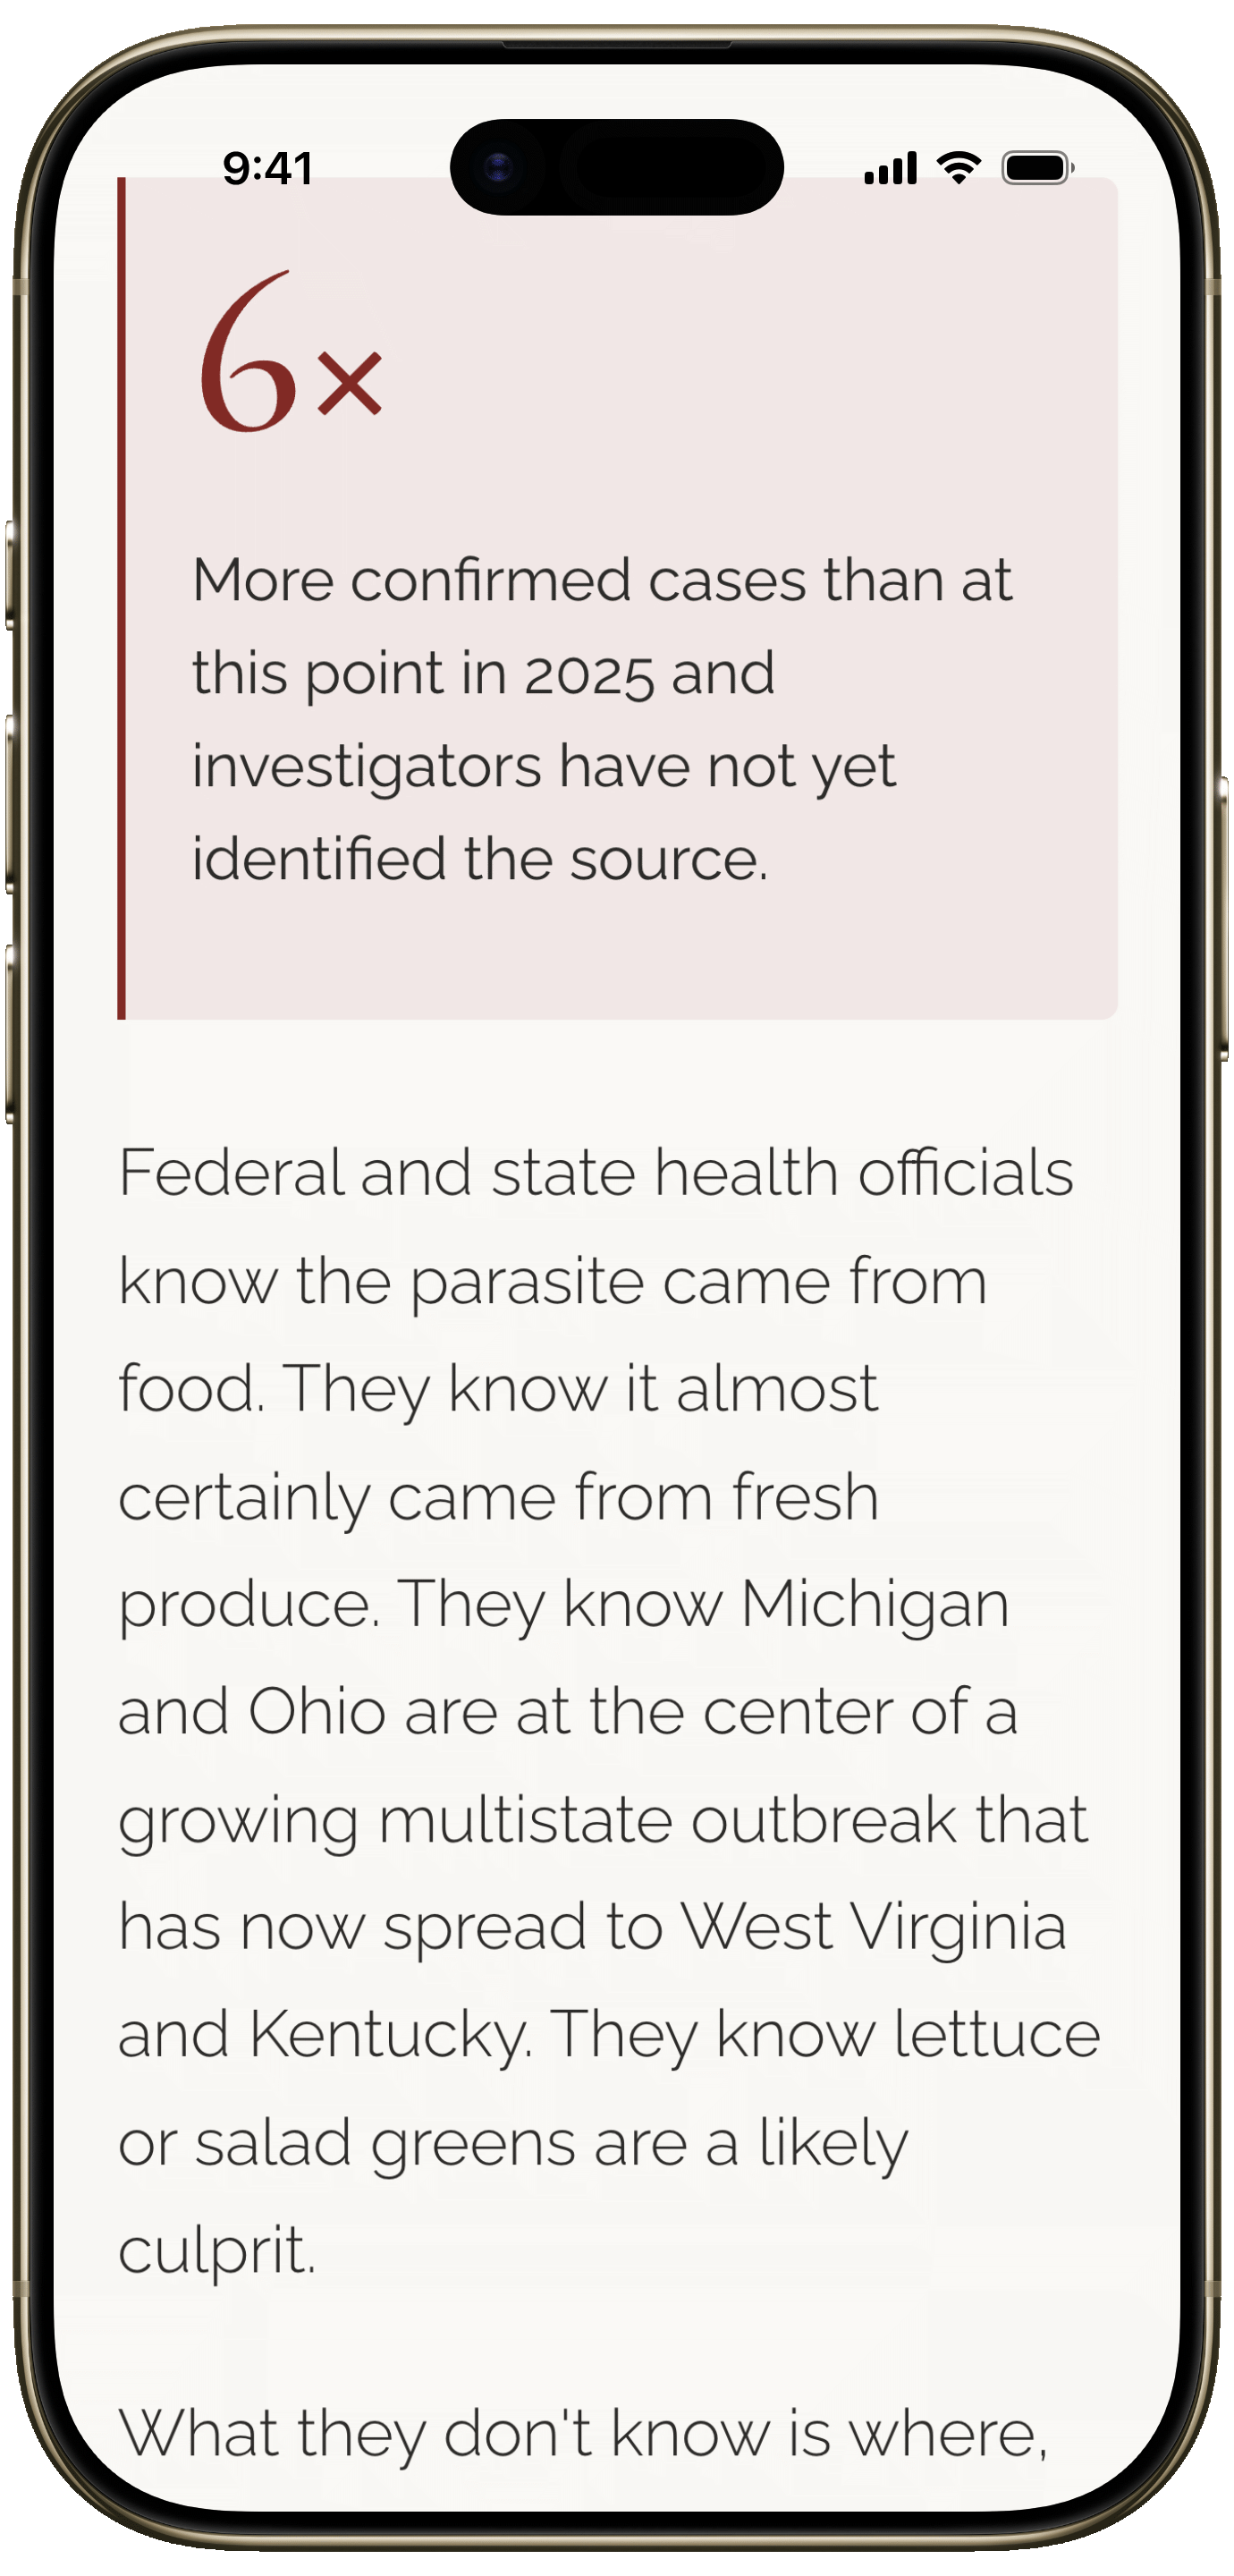
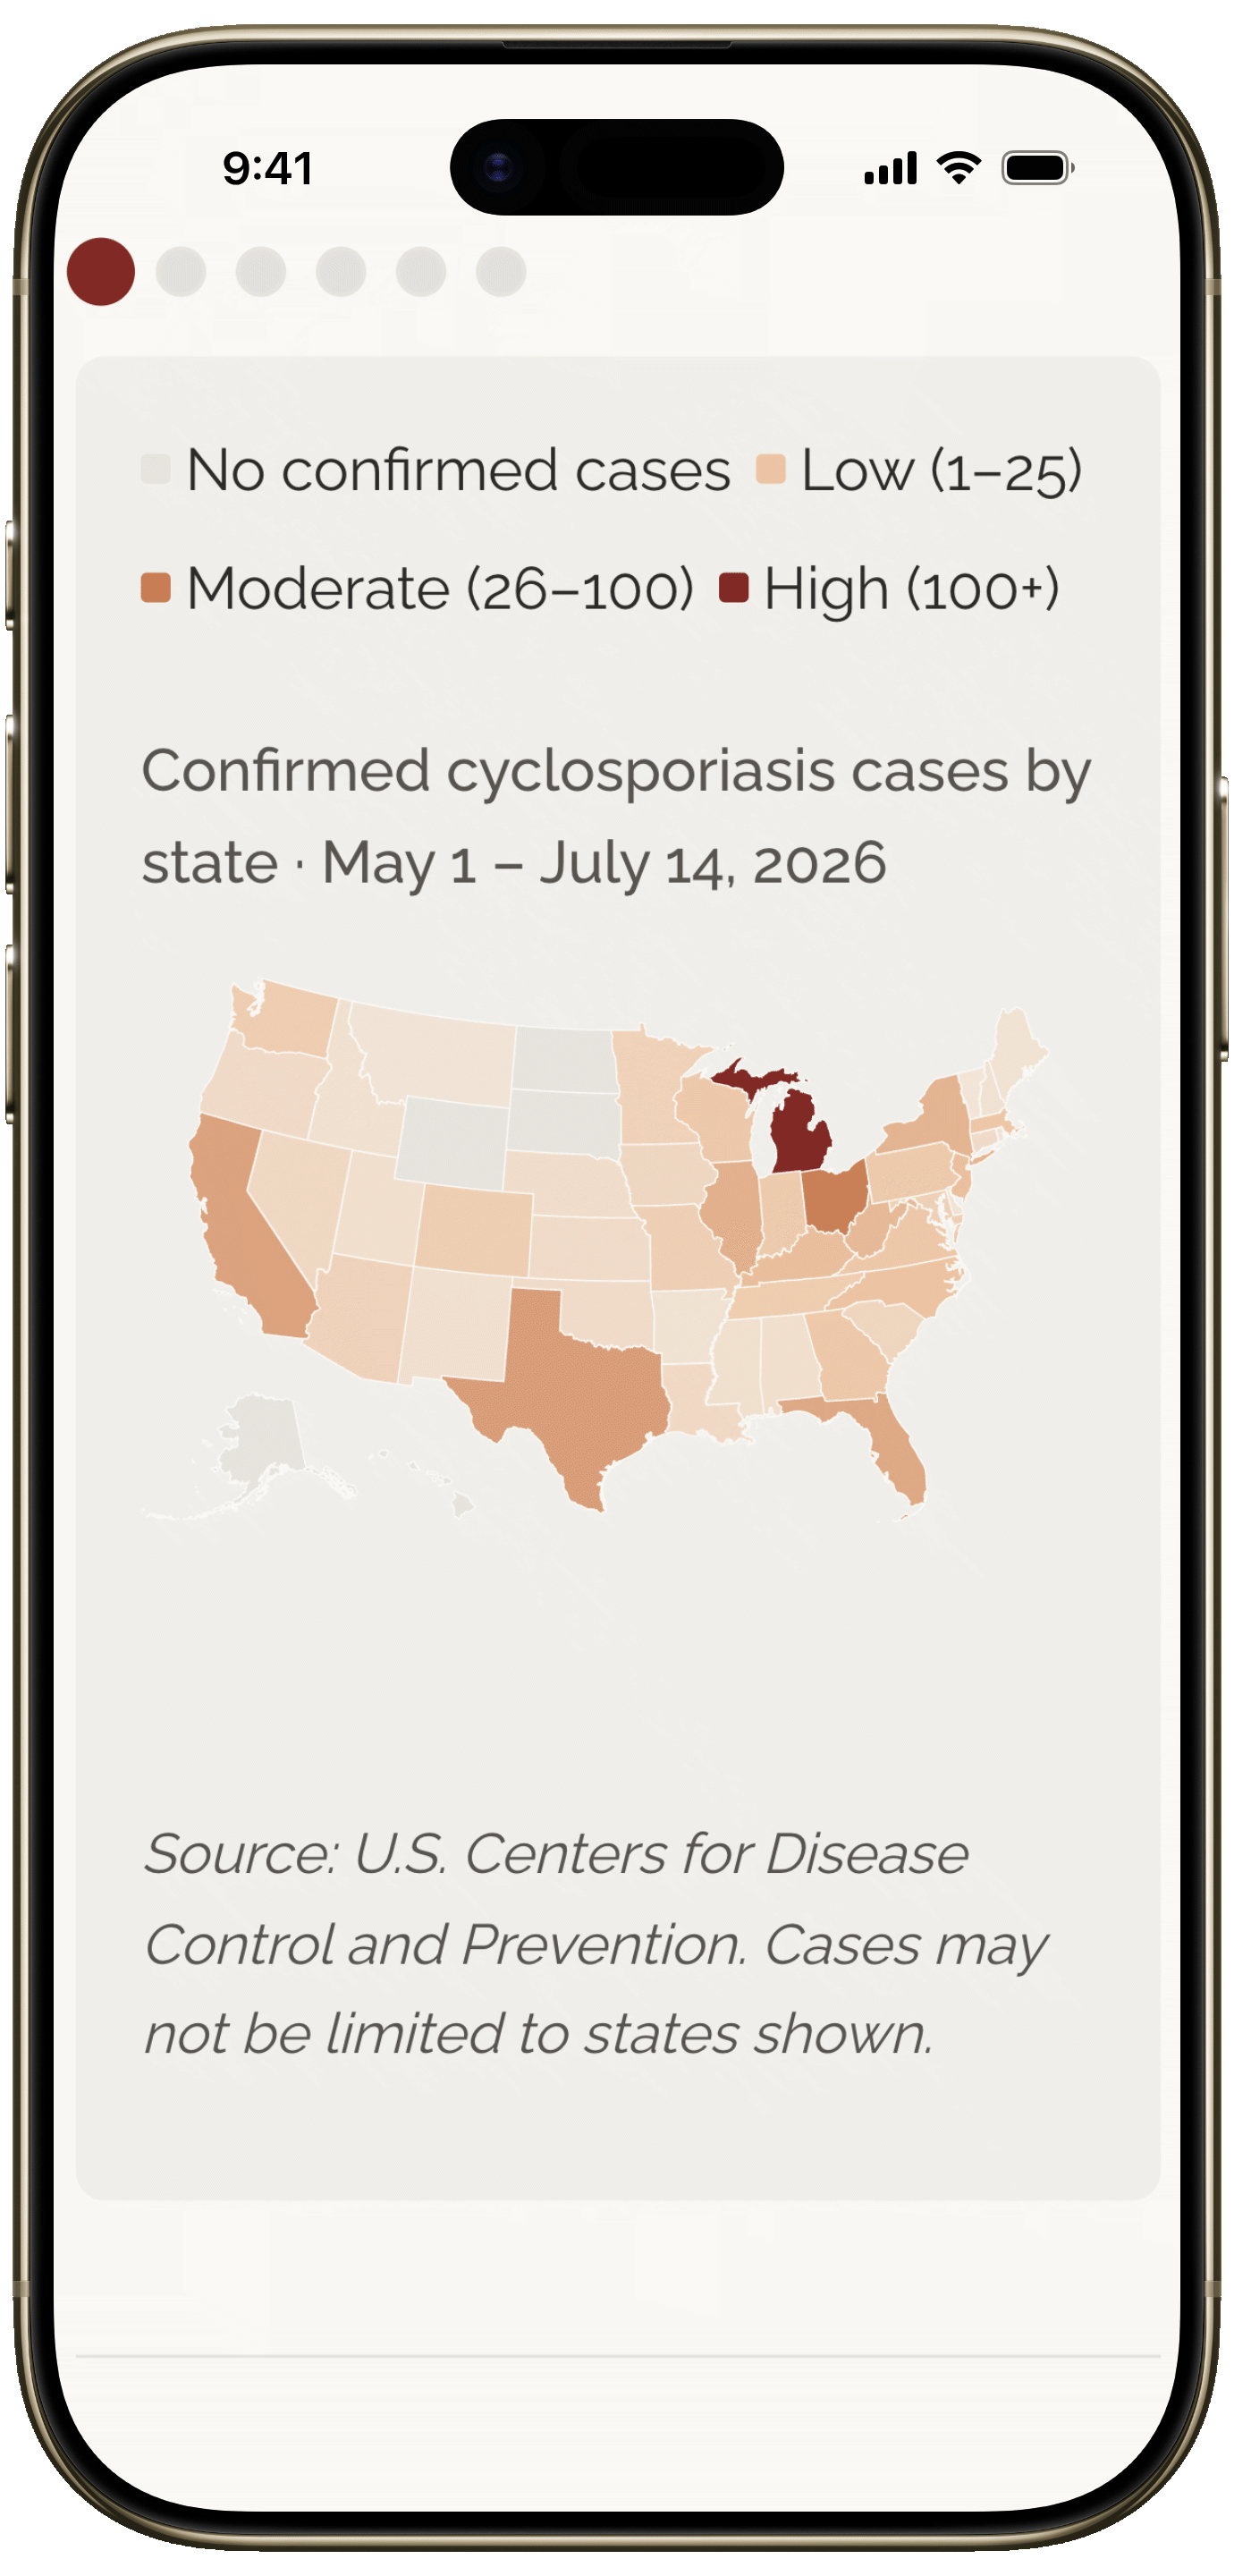
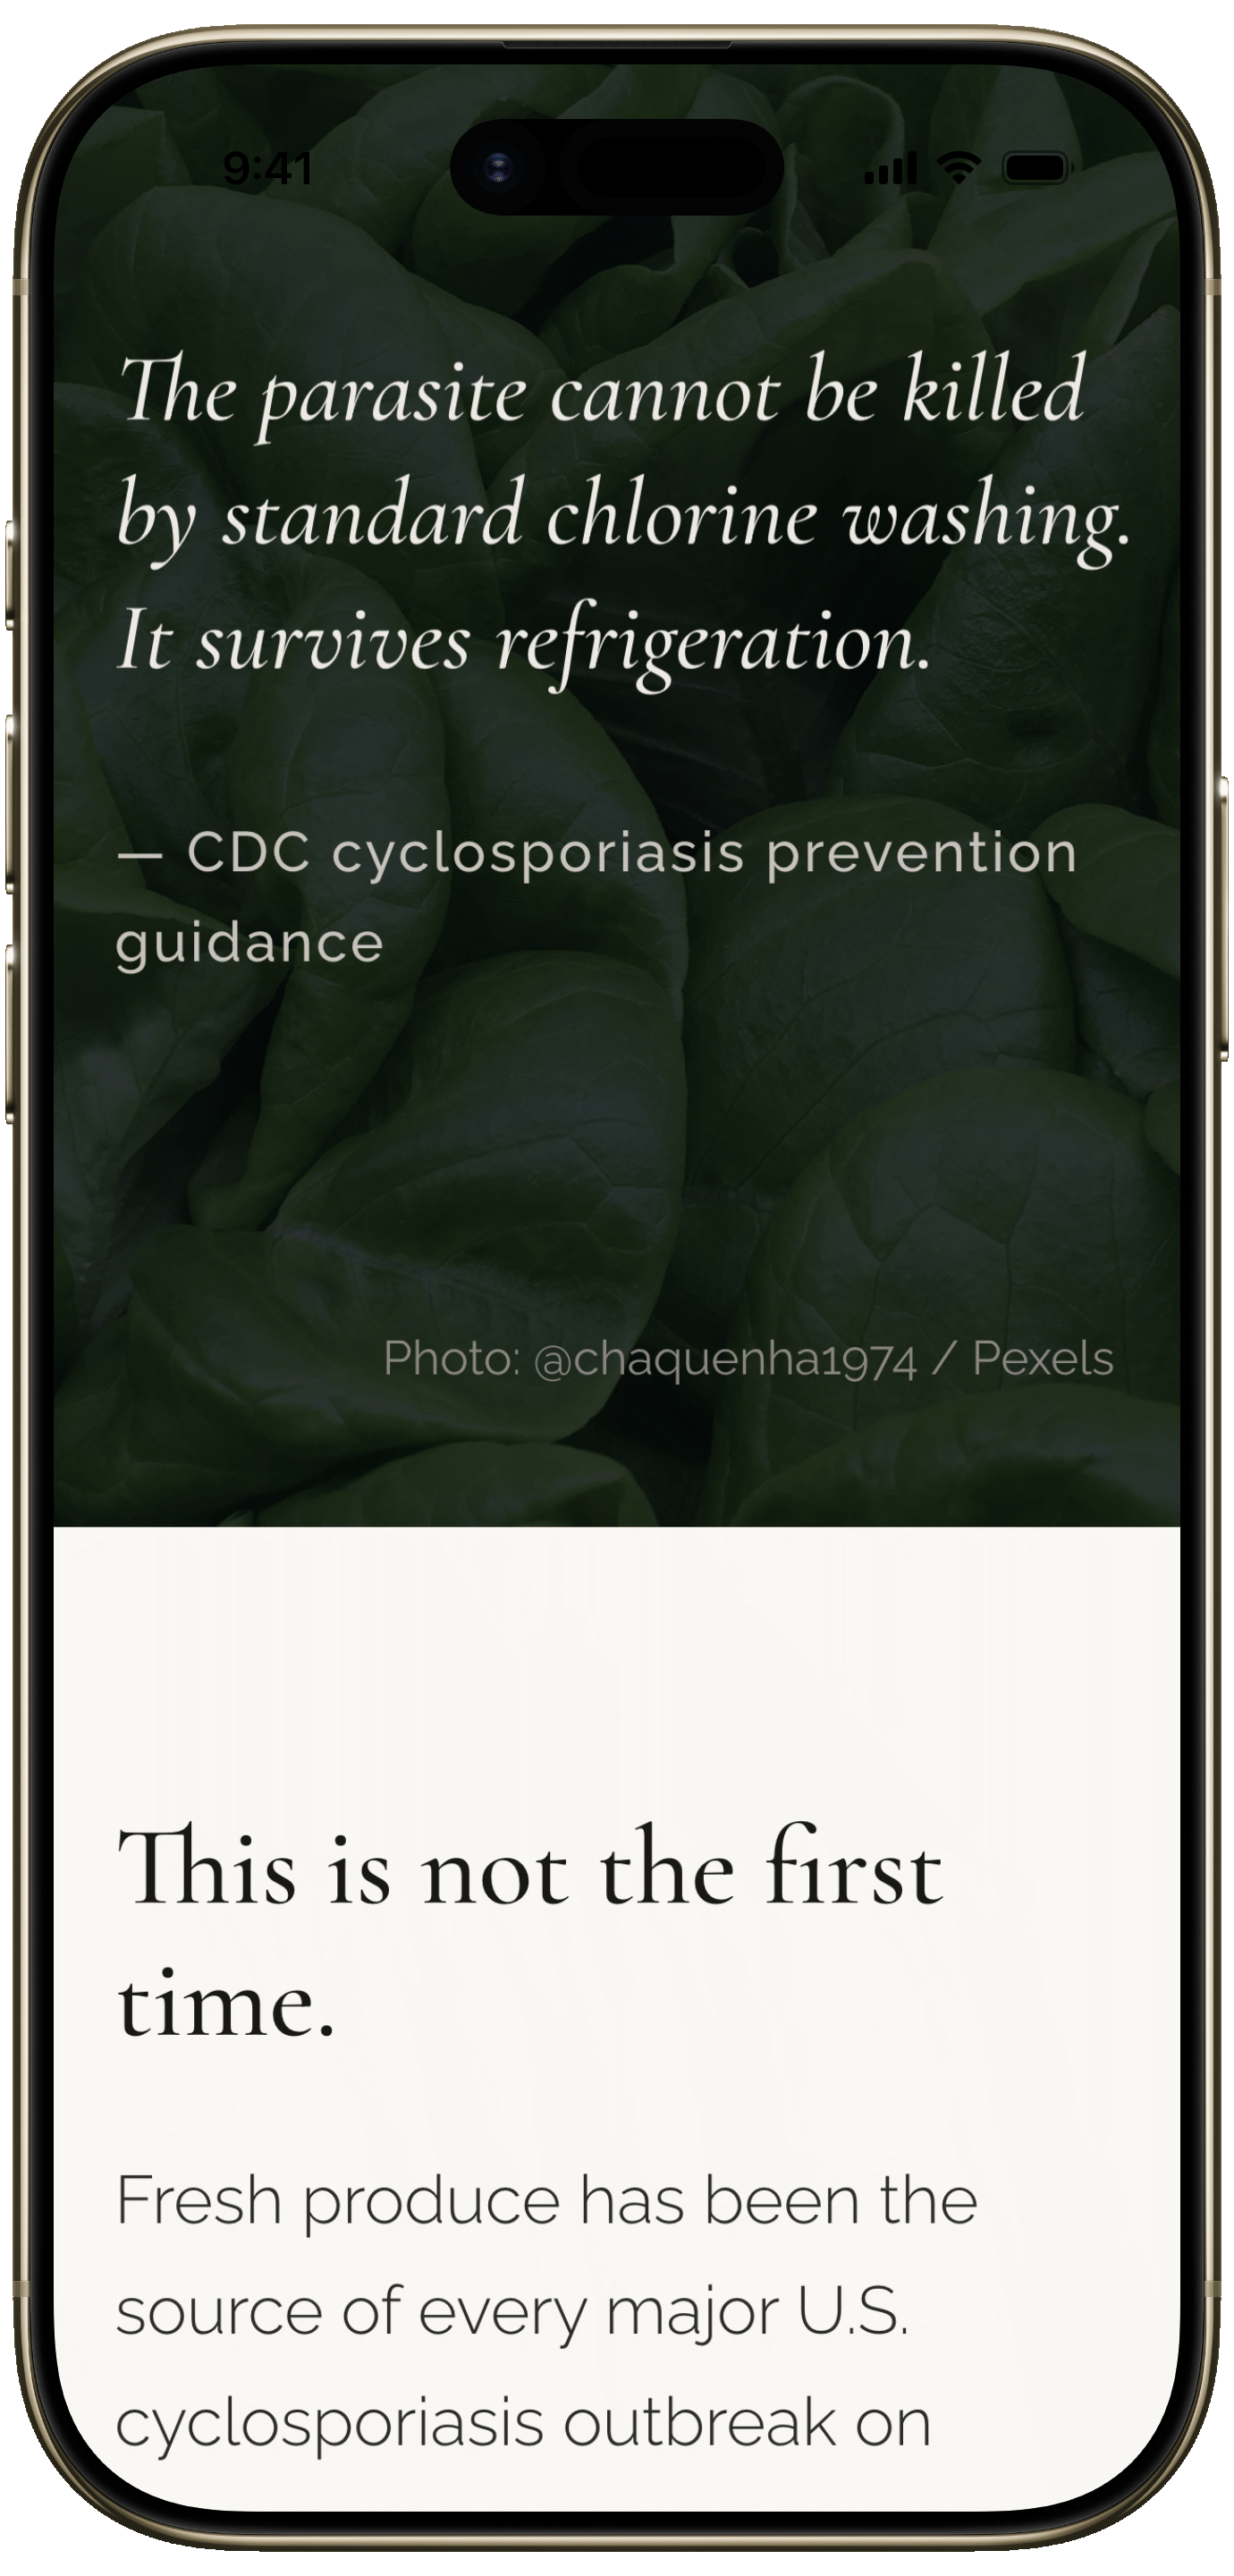
Something Is In The Food is an original longform web documentary investigating the 2026 cyclosporiasis outbreak in the United States. Built entirely from public domain government data, it uses scrollytelling data visualizations, a D3.js choropleth map, an interactive diagnostic pathway, and parallax photography to tell the story of a parasitic illness that has sickened more than 6,700 Americans, in 34 states, from a source investigators have not yet been able to identify.
The piece is structured as five acts, moving from the human stakes of the outbreak through the data, the diagnostic gap that causes most cases to go uncounted, the history of produce-linked outbreaks in the United States, and the weakened federal infrastructure now responsible for investigating it.
Why this Project?
I wanted to build a web documentary that was entirely mine from the ground up: original reporting framing, original prose, no licensing constraints. The cyclosporiasis outbreak was unfolding in real time as I was looking for a subject, and it had everything I look for in a story worth telling this way. A genuine mystery still unresolved. Data rich enough to visualize meaningfully. Human stakes that get lost when the story is told as a brief news item. And a systemic layer, the CDC workforce cuts, the recurring produce supply chain failures, that connects this outbreak to something larger than itself.
The Site
View the live site here! Something is in the Food
Reflections
Let’s be real: D3’s learning curve is a brick wall. The mental model for binding data to DOM elements is wild, and I didn’t tackle it alone. I teamed up with Claude as my coding partner and tutor. Having a virtual assistant explain projections and path generators in real time compressed weeks of head-scratching into a single, highly focused build session. No gatekeeping here, using AI is honestly a superpower, and I’d rather be transparent than pretend I figured it all out from scratch. 😉